Creating and Using Scheduling Analytics Chart Dashlets
The preconfigured Scheduling Analytics Chart Dashlets and Scheduling Analytics Dashboard that ship with Service Board are disabled by default. You can view the default Dashlets and Dashboard in Max Admin, and configure additional Dashlets and Dashboards as your needs dictate, but to generate data, Scheduling Analytics charts must be enabled for your Service Board tenant. Therefore, before you start working with the Scheduling Analytics Dashboard, you must contact ServiceMax Customer Support to enable the charts you want to use.
You can configure the Default Duration values for existing Scheduling Analytics Chart Dashlets per your needs. However, in cases where you want to compare analysis results for varying time intervals, or use different durations for individual applications, you can create additional Dashlets.
To create and use Scheduling Analytics Chart Dashlets:
1. In Max Designer, on the Developer Tools ( ) launchpad menu, click Object Designer, and then in the left pane, search for and click Scheduling Analytics Chart Dashlet.
) launchpad menu, click Object Designer, and then in the left pane, search for and click Scheduling Analytics Chart Dashlet.2. On the object design page, in the left pane, click Records, and then in the list view, in the top left corner, click Create ( ).
).
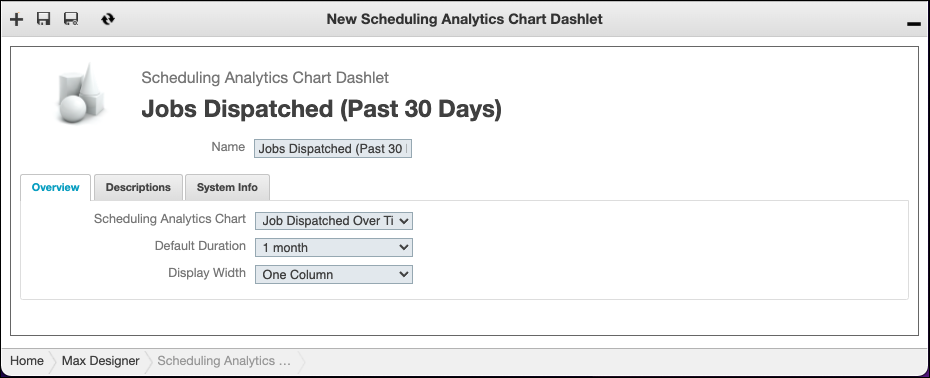
).3. On the record page, complete the fields as follows, and then in the top left corner, click Save and Close ( ).
).
).|
Field
|
Value
|
|---|---|
|
Name
|
The name for this Dashlet that appears on the Dashboard.
|
|
Scheduling Analytics Chart
|
The chart to generate for this Dashlet.
|
|
Default Duration
|
The time interval over which to report data.
|
|
Display Width
|
The number of columns to use for this Dashlet.
|
4. To generate charts for this or any other Dashlet, in the relevant Scheduling Analytics Chart Dashlet record, in the top right corner, in the Actions menu, click Generate Scheduling Analytics Chart.
|
|
• When you create and save Scheduling Analytics Chart Dashlet records, if the chart you configure is enabled on your Service Board tenant, a chart is automatically generated and loaded into the Dashlet.
• URLs for generated charts are stored in Scheduling Analytics Chart Dashlet records, which means that when you click Generate Scheduling Analytics Chart, any previously generated charts are overwritten, and only the most recently generated chart is stored in the relevant record.
|
For more information: